Monitoring Dashboards
Overview
Every Depot environment that is created will have a dedicated CloudWatch Dashboard created. You can use this to keep tabs on various metrics exposed from different components in your environment. It also provides aggregated logs for various Depot components and deployments, including the main Depot API. Access it by visiting your AWS Account's CloudWatch Dashboard console.
Dashboards are always named by convention: sdp-{environment-id}-dashboard.
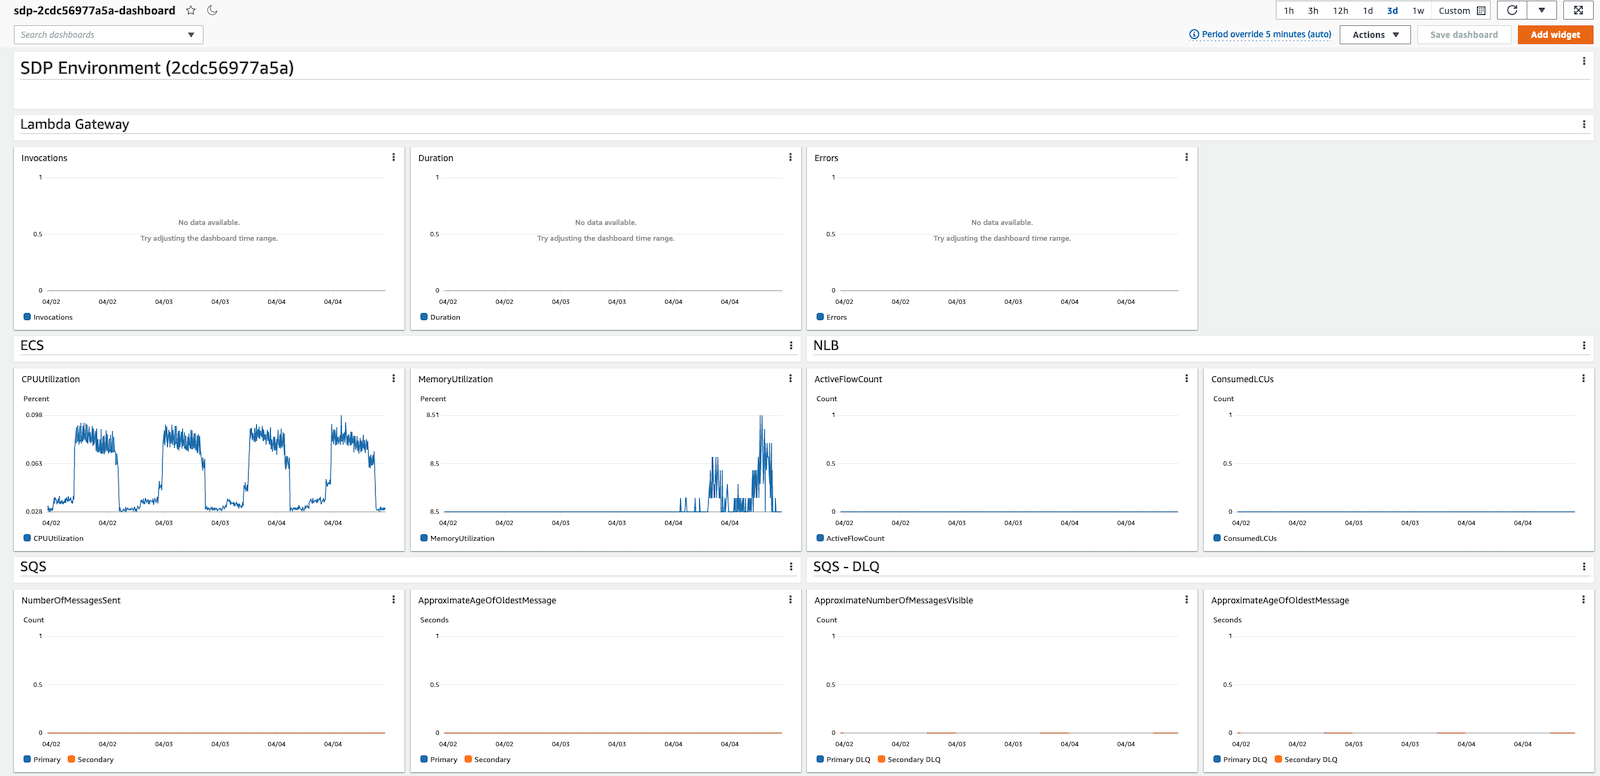
Certain Depot components allow for additional monitoring and metrics to be toggled on. For example, the Depot API which runs on ECS Fargate can have Container Insights toggled on for additional metrics.