Connector Threading
Overview
The Connector divides its work across several thread pools, each with a different job and a different failure mode. The Thread Pools section of your environment's CloudWatch dashboard graphs all of them.
This page is about reading those graphs and deciding what to do. It does not describe the Connector's internals; the design rationale — why each boundary exists, what runs where — is in THREADING.md in the platform repository.
The pools
| Pool | What it does | Healthy shape |
|---|---|---|
| undertow worker | Accepts HTTP requests and hands them straight on | busy well below pool size |
| depot-worker | All request processing and response building. Never waits on I/O | active rising and falling with load; queued near zero |
| depot-dbconn | Acquires database connections | spiky, returning to baseline |
| depot-dbfetch | Waits on database result fetches | spiky, returning to baseline |
| depot-syncio | Blocking I/O kept off depot-worker | pool size at 0 when idle; queued at 0 outside a cold start |
Each pool graph carries the same five series:
| Series | Meaning |
|---|---|
active(sum), active(max) | threads currently running a task |
pool size | threads that exist right now |
queued(sum), queued(max) | tasks waiting for a thread |
Reading the graphs
The useful signal is not any single series — it is the relationship between active, pool size
and queued.
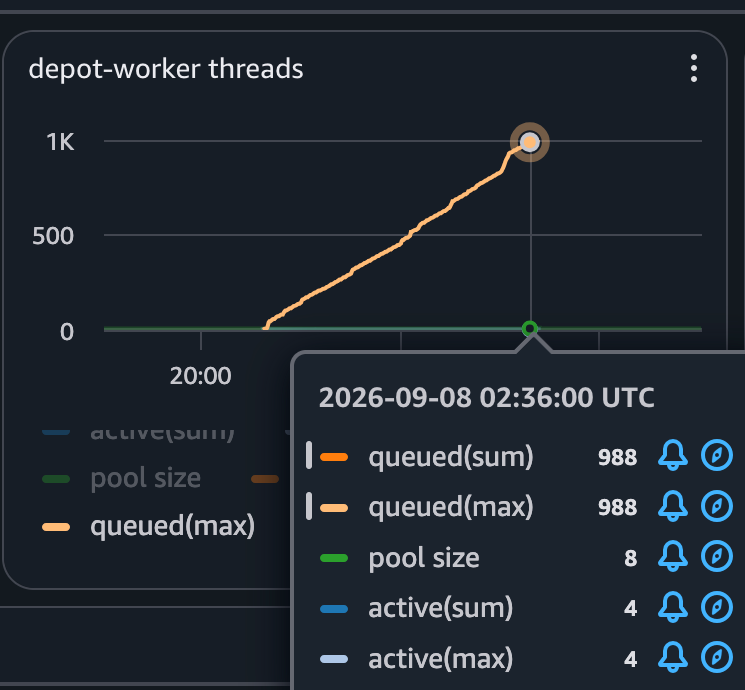
The graph above looks like overload and is not. The queue climbs in a straight line to 988 and
keeps going, but pool size is 8 and active is 4: half the pool is idle while a thousand
tasks wait.
A saturated pool has active pinned at pool size. This one does not, so the threads are blocked
rather than busy. Work occupies a thread and never completes, and the queue grows without limit
because effective capacity has fallen to the threads that remain.
A growing queue means "too small" only when the pool is at capacity.
The straight line is a second signal. Real load is lumpy and recovers between peaks; a constant slope means arrivals continuing against a service rate near zero.
Symptoms and what to do
| What you see | What it means | What to do |
|---|---|---|
queued growing, active below pool size | Threads are blocked, not busy. Capacity is falling, not exceeded | Do not resize. Capture a thread dump and escalate — this is a defect, and a bigger pool only delays it |
queued growing, active at pool size | Genuine saturation | Raise the pool size, or reduce the load reaching it |
queued spiky but returning to zero | Normal bursty traffic | Nothing |
pool size drops to 0 while idle | Expected for depot-syncio, which retires idle threads | Nothing. Absence of threads is not absence of metrics |
depot-syncio queued non-zero outside a cold start | Too few threads for the concurrent resolutions | Raise threadPools.syncIo.threads, not the queue capacity |
queued flat at exactly 0 under real load | The pool has no queue — it rejects instead of waiting | Expected for depot-dbfetch and depot-dbconn by default. See below |
undertow worker pool size steps down | A task was replaced, so you are seeing a different task's metrics | Nothing, unless it repeats |
The JDBC queue metrics read 0 by design
depot-dbfetch and depot-dbconn default to having no queue at all. When every thread is busy
they reject work rather than queueing it, so their queue.size series is flat at zero regardless of
load, and queue-based saturation signals cannot fire for them. Their pressure shows up as errors
instead.
Set frontend.threadPools.dbPoolQueueCapacity to give them a real queue and make those graphs
meaningful. See Connector Tuning.
Alarms
When opsAlarms is enabled, the depot-worker and depot-syncio queues are each alarmed at 80% of
their configured capacity — 800 by default, and derived from
threadPools.depotWorker.queueCapacity or threadPools.syncIo.queueCapacity when either is set.
80% fires ahead of the Connector's own health check, which starts shedding the instance at 90%.
The depot-syncio alarm matters more than its size suggests. Past its queue the pool does not
reject: it borrows a depot-worker thread and does blocking I/O on it, which is what depot-worker
exists not to do. Nothing else signals that before it starts.
There is no alarm on the depot-dbfetch or depot-dbconn queues, because with the default
configuration those queues are always empty — see above. Alarming them only becomes meaningful once
dbPoolQueueCapacity is set.
See Alarms and Alerting for how alarms reach Slack.
Which knob to turn
Work out which pool is under pressure first, then consult Connector Tuning for the property that governs it.
Two changes look correct and achieve nothing:
- Resizing a blocked pool. If
activesits belowpool size, the added threads block too. - Deepening a queue to raise throughput. A queue absorbs bursts. A persistently deep queue means the pool behind it is too small; a deeper queue only lengthens the wait.
Related
- Connector Tuning — every tunable, with its CDK property and default.
- Monitoring Dashboards — where to find the dashboard.
- Alarms and Alerting — routing alarms to Slack.